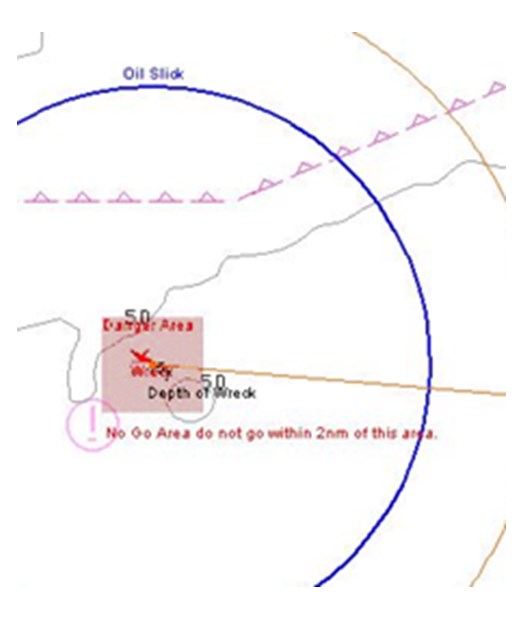
Slide 5 – Adding Information Introduction
A clean chart is not adequate for navigation. The objective here is to introduce the concept of adding information to the chart on the ECDIS. In the following slides, hotspots will show where you can construct areas, lines, points and text by utilising system features to add additional information.
It would be good at this point to refresh yourself in how to make/plot fictional, temporary chart information.

